

Etsy saturation is usually described by how many listings a category holds. That measures history. A more useful question is how fast new sellers are arriving, and across 60 tracked categories that rate ranges from 8.4% a year to 37.7%.
Listing count is the wrong measure
A category with six million listings built over a decade is not necessarily filling faster than one with a hundred thousand. What determines whether your listing gets buried next year is the rate of arrival, not the accumulated total.
Measured this way, etsy saturation averages 20.9% new shop entry over twelve months across the tracked set. The spread around that average is what this index measures.
Filling fastest
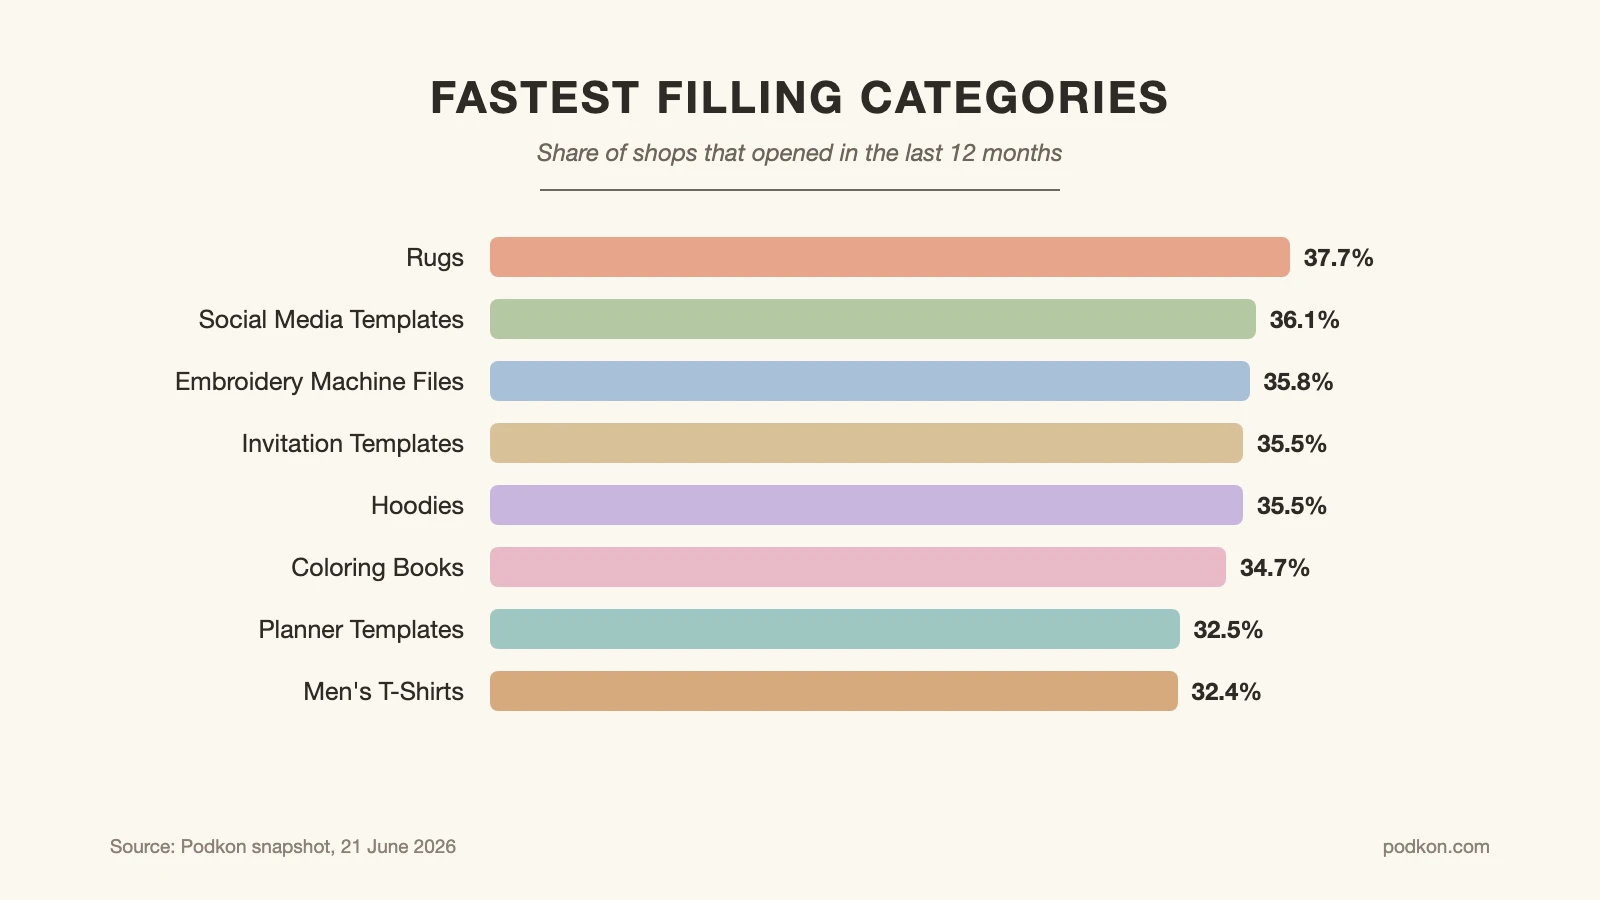
| Category | New shops in 12 months |
|---|---|
| Rugs | 37.7% |
| Social Media Templates | 36.1% |
| Embroidery Machine Files | 35.8% |
| Invitation Templates | 35.5% |
| Hoodies | 35.5% |
| Coloring Books | 34.7% |
| Planner Templates | 32.5% |
| Men’s T-Shirts | 32.4% |
These eight categories are absorbing new sellers at more than twice the rate of the slowest. Three of the top four are digital formats, which is consistent: a template or a design file can be produced in a weekend, and the barrier that keeps people out of glassware or jewellery does not exist.
Filling slowest
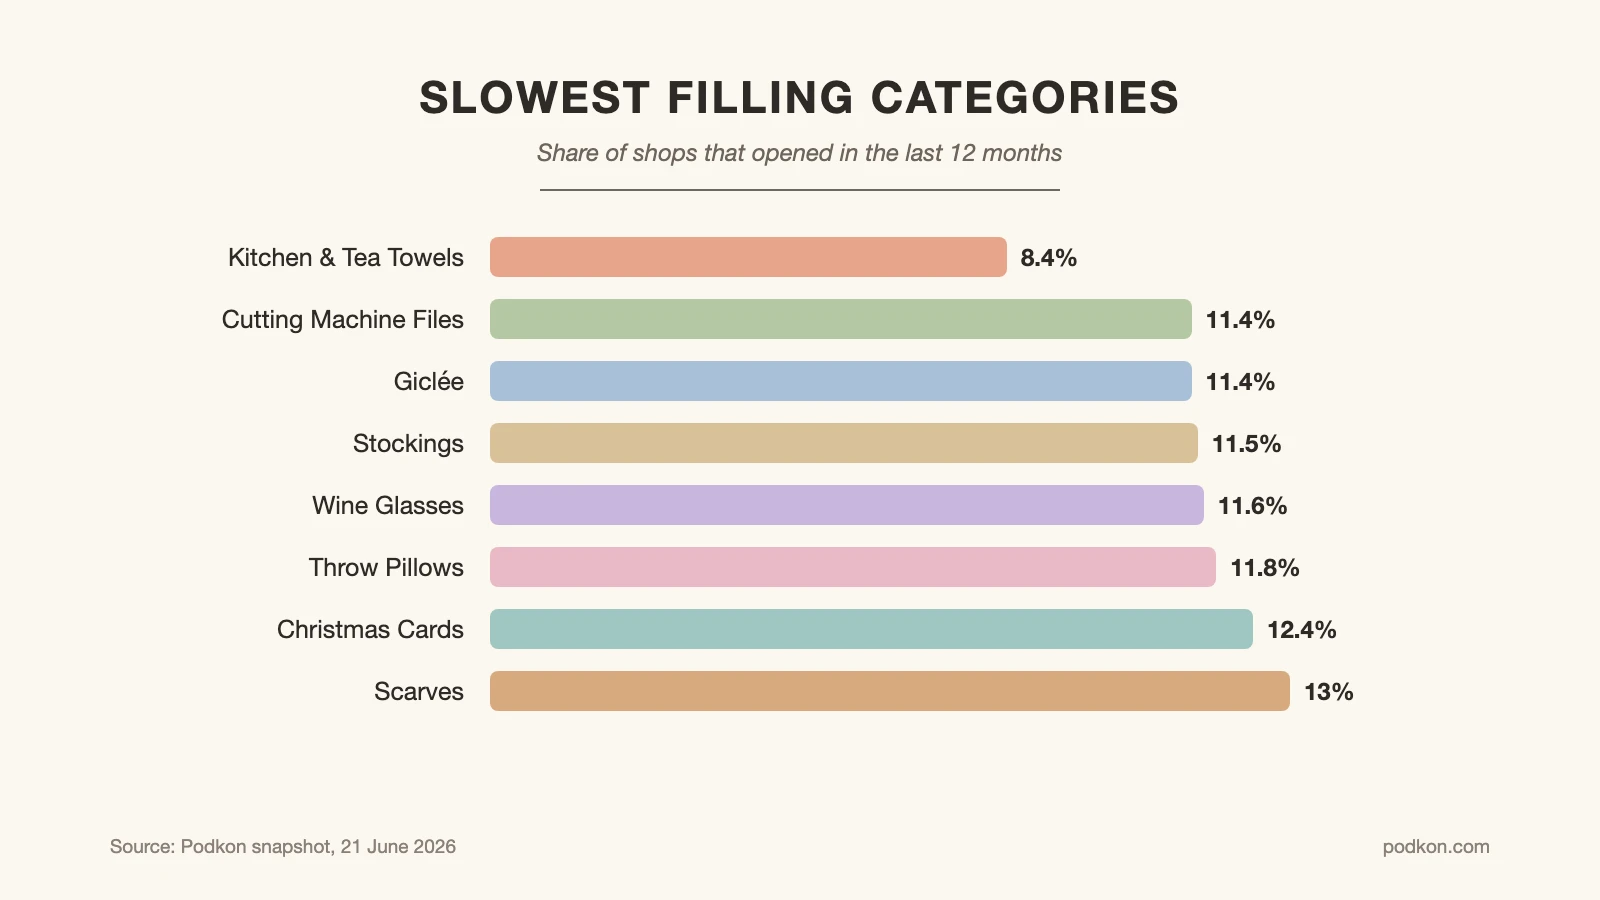
| Category | New shops in 12 months |
|---|---|
| Kitchen & Tea Towels | 8.4% |
| Cutting Machine Files | 11.4% |
| Giclée | 11.4% |
| Stockings | 11.5% |
| Wine Glasses | 11.6% |
| Throw Pillows | 11.8% |
| Christmas Cards | 12.4% |
| Scarves | 13% |
The slow end is dominated by categories needing equipment, inventory or both. Engraving, silk, fabric stock and packing fragile goods all appear here, and each one filters out casual entrants more effectively than competition does.
🔢 Quick Numbers
- New shop entry ranges from 8.4% to 37.7% a year across 60 categories (snapshot, 21 June 2026)
- The average across the tracked set is 20.9% (snapshot, 21 June 2026)
- Fastest filling: Rugs at 37.7% (snapshot, 21 June 2026)
- Slowest filling: Kitchen & Tea Towels at 8.4% (snapshot, 21 June 2026)
The second half of the index
Entry rate tells you who is arriving. Catalogue refresh tells you whether they are still publishing once they have. The share of listings created in the last thirty days ranges from 1% at the bottom to 32.2% at the top across the same 60 categories.
A category can be crowded and idle at once. Several of the largest markets in this set have entry rates above thirty percent and refresh rates below five, which describes people arriving, publishing once and stopping.
⚖️ Pros & Cons at a Glance
✔️ Pros: a high entry rate tells you where competition is forming before listing counts show it, and a low refresh rate marks categories where existing sellers have stopped defending their positions
✖️ Cons: entry rate alone says nothing about demand, a slow filling category may be slow because nobody wants it, and both measures are snapshots rather than trends
Both columns are worth holding at once, because the index is a diagnostic rather than a verdict.
📌 Did You Know?
The category filling fastest in this set is Rugs at 37.7%, and it also carries one of the highest median prices measured. High prices attract entrants regardless of how hard the operating model is, which is worth remembering when a category looks unusually profitable from the outside.
How to read the Etsy saturation index
An etsy saturation reading above thirty percent means roughly a third of your competition arrived within the last year. That is not automatically bad, since a young field also has no entrenched incumbents, but it does mean any advantage you build has a short shelf life unless it rests on something hard to copy.
Below fifteen percent, the opposite applies. The field is stable, the incumbents are established, and whatever is keeping people out will apply to you as well. Our low competition niches guide covers reading that properly, and our product research method covers testing before committing.
Etsy’s Seller Handbook covers listing fundamentals, Statista’s active seller series shows how the total seller base has grown, and Etsy’s full year 2025 results give the marketplace level context.
All category figures come from Podkon’s marketplace snapshot dated 21 June 2026 and describe the tracked listing sample, not all of Etsy. Etsy fee rates were current on the Fees and Payments Policy page as last updated 13 February 2026 and can change.
Where to Go From Here
Your Next Step: Look up the entry rate for the category you are in or considering, then ask what specifically is keeping the number where it is. If you cannot name the barrier, there probably is not one, and the rate will rise.