


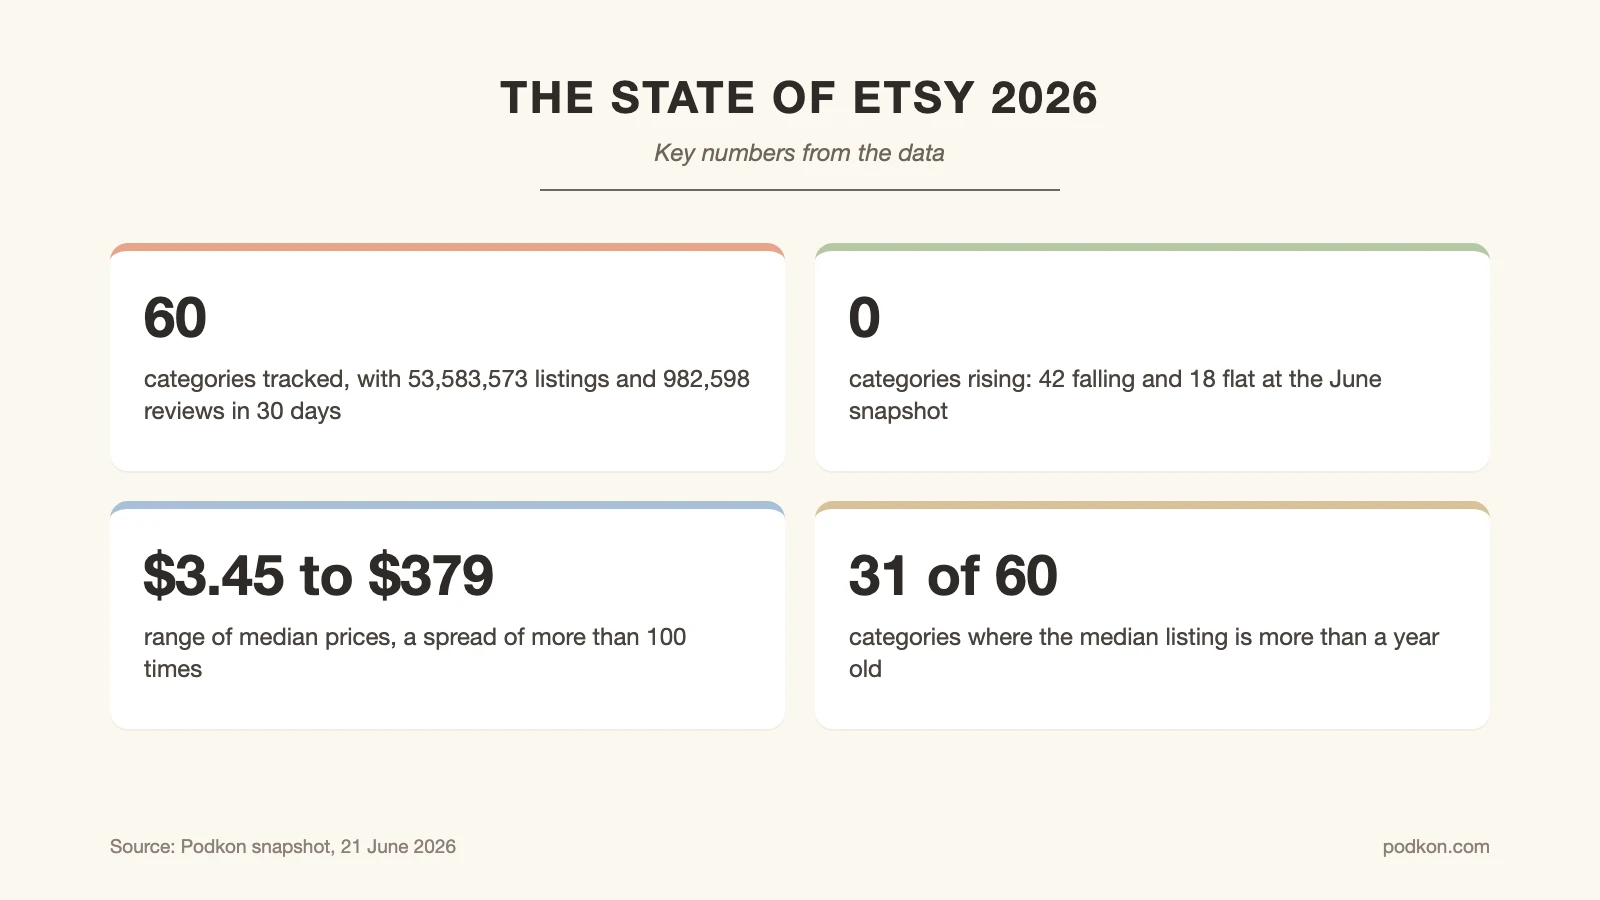
This state of etsy report covers 60 categories measured on the same day against the same metrics: 53,583,573 listings, 982,598 reviews recorded in a thirty day window, and prices spanning from $3.45 to $379. Four patterns run through all of it.
One: nothing was rising
Of 60 categories, 42 were flagged as falling and 18 as flat. None were rising. The snapshot was taken on 21 June, near the annual low for most seasonal categories, which explains a large part of that, but the absence of a single rising category across the whole tracked set is the most striking single fact in this report.
Read it as a seasonal floor rather than a marketplace verdict. Any state of etsy reading taken in one month carries that caveat. Etsy’s own full year 2025 results describe platform level performance, and a June category snapshot is not a substitute for it.
🔢 Quick Numbers
- 60 categories, 53,583,573 listings, 982,598 reviews in 30 days (snapshot, 21 June 2026)
- 42 categories falling, 18 flat, 0 rising (snapshot, 21 June 2026)
- Median prices span $3.45 to $379, a spread of more than 100 times (snapshot, 21 June 2026)
- 31 of 60 categories have a median listing older than one year (snapshot, 21 June 2026)
Two: the shelves are old
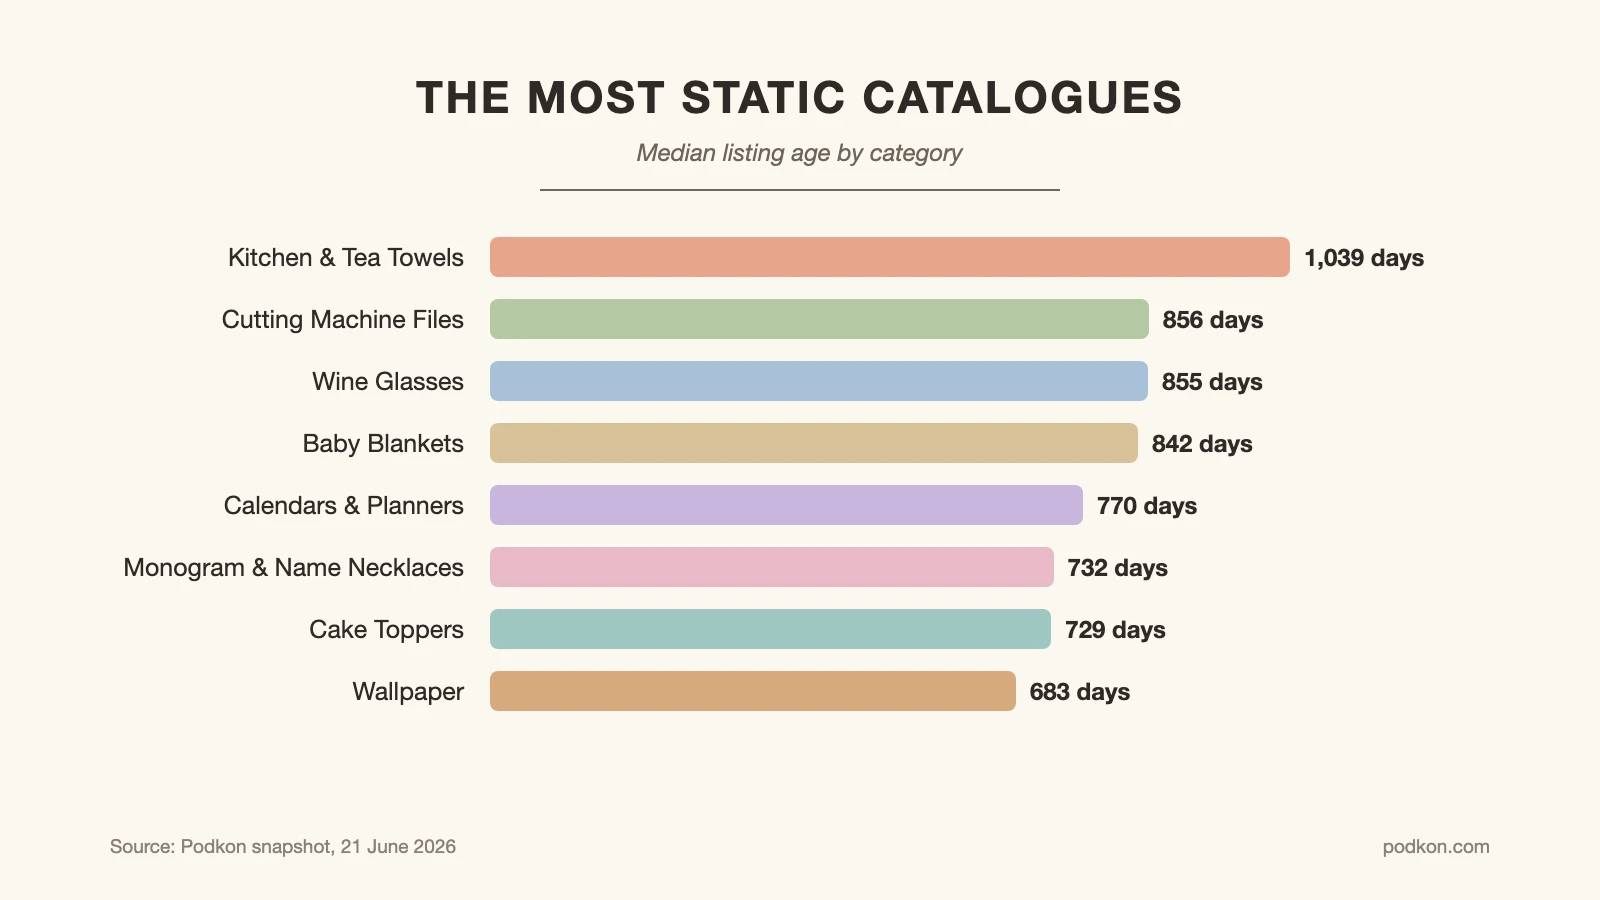
In 31 of 60 categories, the median listing is more than a year old. In Kitchen & Tea Towels it is 1,039 days, close to three years. These are markets still collecting views and still competing for searches, with inventory nobody has updated.
That was the single most common pattern in this series and the most actionable one. Attention on Etsy is rarely the scarce resource; fresh supply is.
The most static catalogues
| Category | Median listing age |
|---|---|
| Kitchen & Tea Towels | 1,039 days |
| Cutting Machine Files | 856 days |
| Wine Glasses | 855 days |
| Baby Blankets | 842 days |
| Calendars & Planners | 770 days |
| Monogram & Name Necklaces | 732 days |
| Cake Toppers | 729 days |
| Wallpaper | 683 days |
Three: entry rate, not listing count, measures pressure
New seller entry over twelve months ranges from 8.4% to 37.7%, averaging 20.9%. The fastest filling categories are almost all digital, where a file can be produced in a weekend. The slowest need equipment, stock or the ability to ship something fragile.
Listing counts describe accumulated history. Entry rate describes what is arriving, and the two frequently point in opposite directions.
⚖️ Pros & Cons at a Glance
✔️ Pros: category level data reveals structural facts that keyword tools cannot: entry rates, catalogue age, price distribution and the gap between attention and conversion
✖️ Cons: a single snapshot cannot separate seasonality from decline, review counts understate sales unevenly across categories, and none of it substitutes for testing in your own shop
Four: buyers search occasions, sellers write descriptions
Across the tracked set, a clear majority of categories carry a gift, holiday or occasion term among their eight most used tags. Housewarming, baby shower, birthday, christmas and wedding all appear as leading terms in categories where a seller might reasonably expect only product descriptions.
The mismatch is consistent enough to be worth acting on directly: most listings are written to describe an object, and a large share of the demand is looking for a present.
📌 Did You Know?
Views per listing vary by more than a factor of fourteen across the tracked set, from 265 in Mugs to 4,452 in Monogram & Name Necklaces. The highest attention categories are almost all personalised gifts, where buyers compare extensively before committing to a name or a date they cannot change.
Both columns matter when reading anything that follows.
📐 Technical Note
Every figure here comes from a single marketplace snapshot dated 21 June 2026, covering a tracked sample of listings rather than all of Etsy. Fee figures come from Etsy’s Fees and Payments Policy as last updated 13 February 2026. Reviews are used as a sales proxy throughout, because Etsy does not publish per category sales data.
What the state of Etsy data does not tell you
A state of etsy report built this way does not tell you whether a category is profitable, because production cost sits outside the data. It does not tell you whether demand is genuinely declining, because one June reading cannot separate a trend from a season. And it does not tell you what buyers thought of what they bought, because review counts carry no sentiment.
What it does establish is the shape of the competition you would be entering, and that is usually the part sellers guess at. Our what to sell breakdown covers turning this into a decision, our product research method covers validating one, and our trends coverage follows the same questions through the year.
Etsy’s Seller Handbook remains the platform’s own reference, and Statista’s active seller series gives the long run growth backdrop.
All category figures come from Podkon’s marketplace snapshot dated 21 June 2026 and describe the tracked listing sample, not all of Etsy. Etsy fee rates were current on the Fees and Payments Policy page as last updated 13 February 2026 and can change.
Looking Ahead
The most useful conclusion from 60 categories is not a list of what to sell. It is that the question sellers ask most often, whether a category is too crowded, is usually the wrong one. Crowding is easy to see and easy to overreact to. What the data actually rewards is noticing where a crowd arrived years ago, stopped publishing, and left a shelf of aging listings collecting the same attention it always did.