


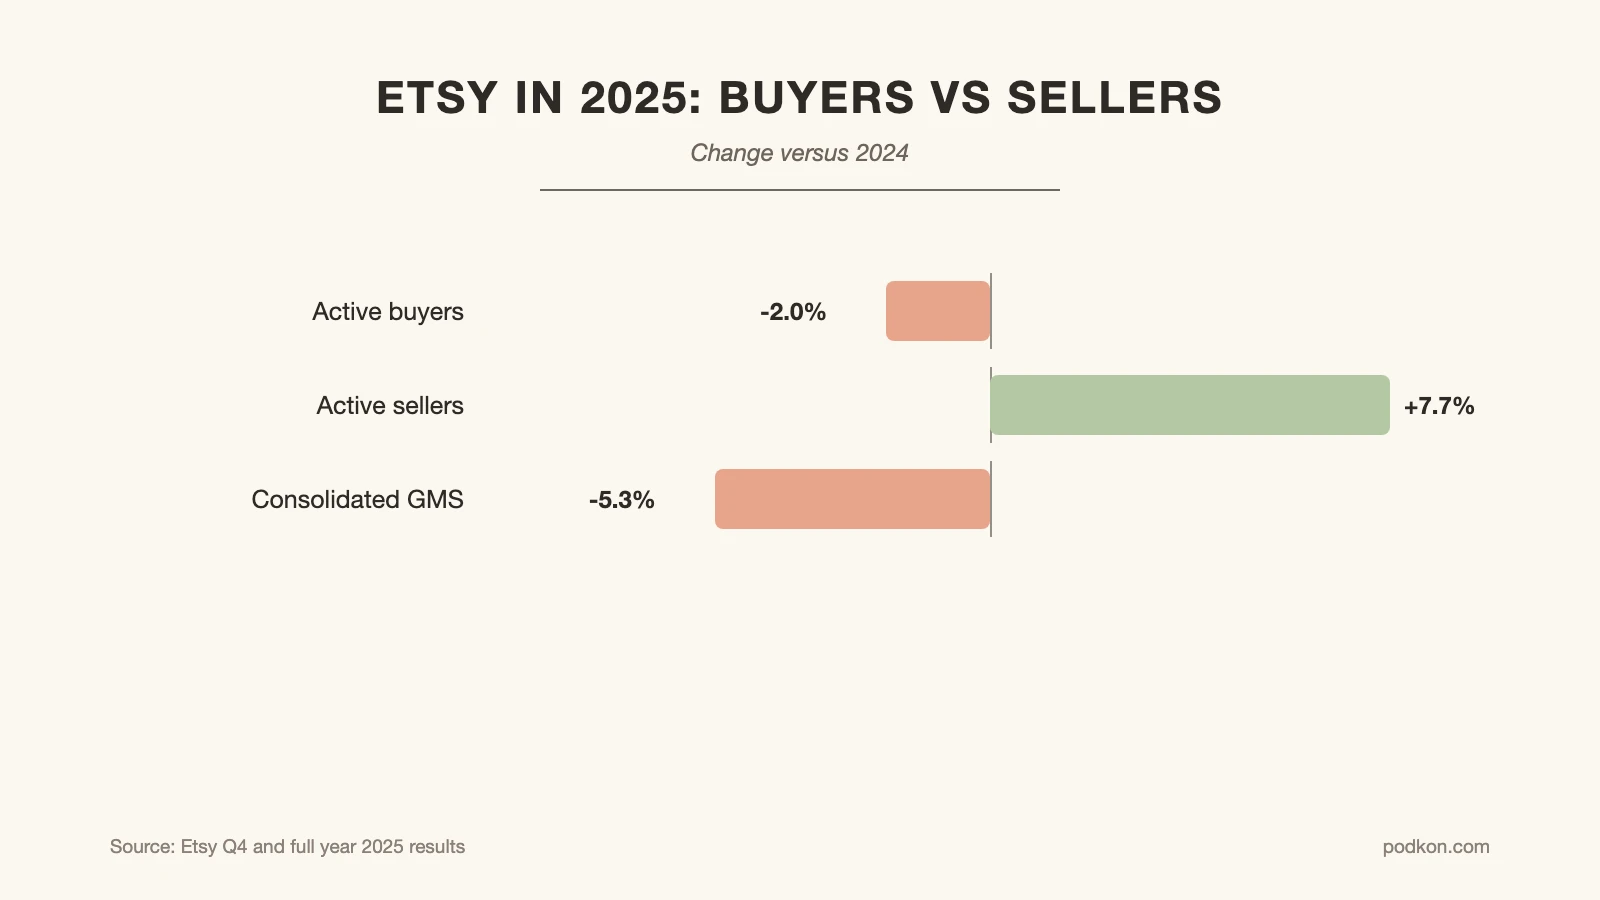
Two numbers in Etsy’s own 2025 annual results explain more about selling on the platform in 2026 than any keyword tool can. Active buyers fell 2.0% over the year. Active sellers rose 7.7%. Everything else follows from that divergence.
The buyer and seller lines are moving apart
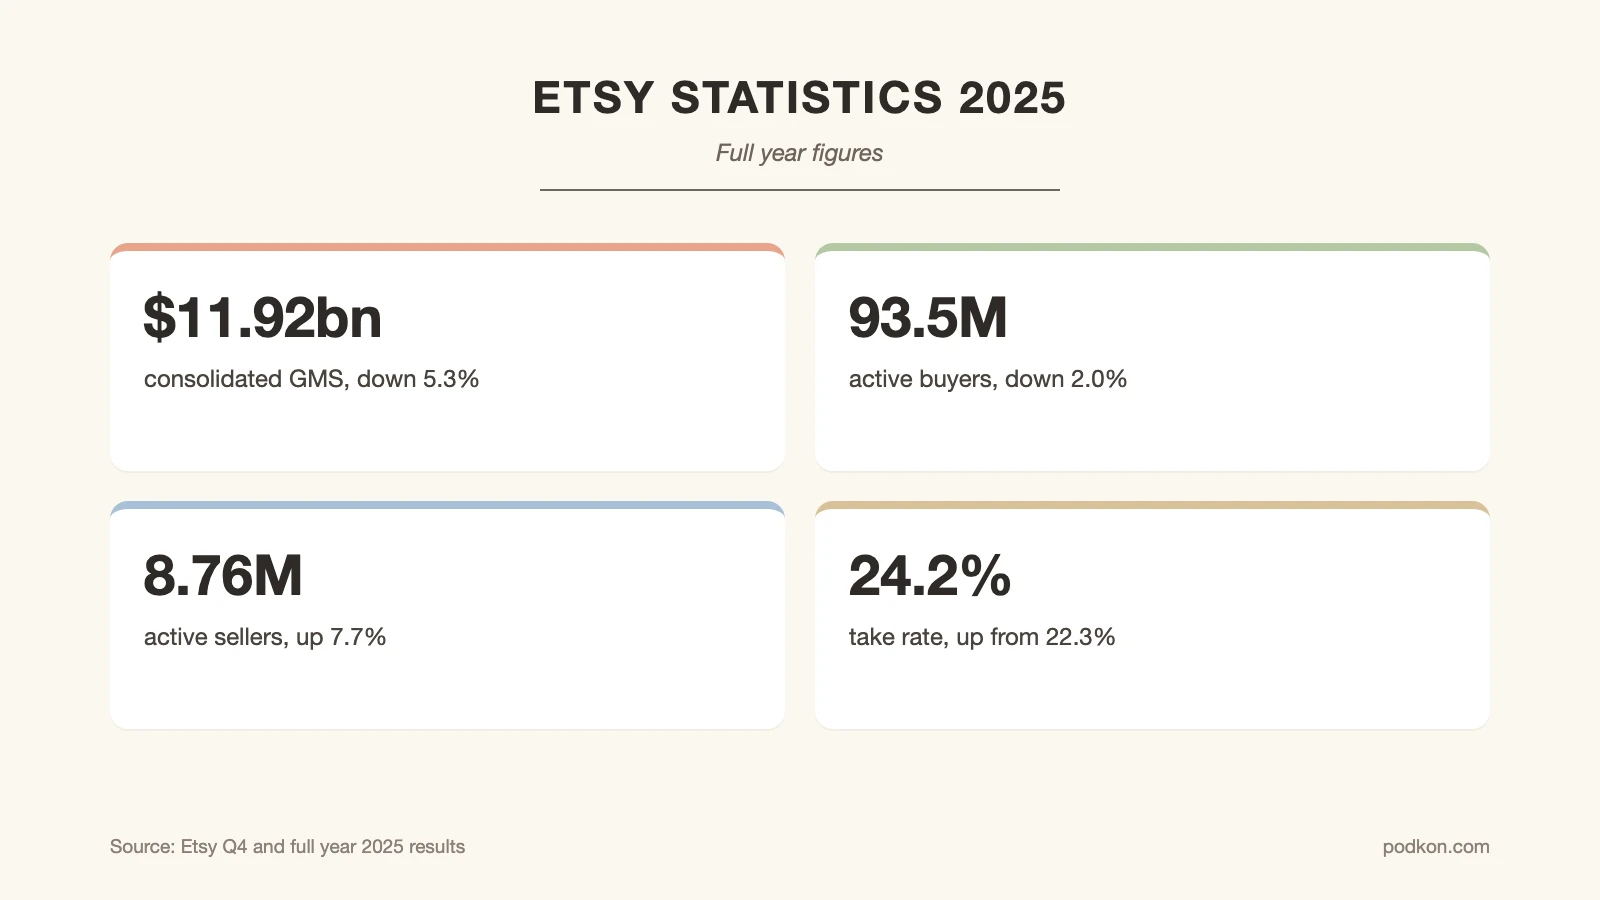
Etsy reported 93,539 thousand active buyers at the end of 2025, down 2.0% year over year, alongside 8,762 thousand active sellers, up 7.7%. Fewer people buying, more people selling. That is the single most consequential fact in this year’s etsy statistics.
The rest of the etsy statistics fill that picture in. Consolidated gross merchandise sales for the full year came to $11,916.90 million, down 5.3% against the prior year, though the fourth quarter alone was up 2.4% excluding Reverb. Revenue reached $2,883.50 million.
Etsy’s reported 2025 results
| Metric | Full year 2025 | Change |
|---|---|---|
| Consolidated GMS | $11,916.90 million | down 5.3% |
| Revenue | $2,883.50 million | up |
| Active buyers | 93,539 thousand | down 2.0% |
| Active sellers | 8,762 thousand | up 7.7% |
| Take rate | 24.2% | up from 22.3% |
🔢 Quick Numbers
- Active buyers down 2.0% and active sellers up 7.7% in 2025 (Etsy Q4 and full year 2025 results)
- Consolidated GMS $11,916.90 million, down 5.3% year over year (Etsy Q4 and full year 2025 results)
- Take rate 24.2% for the full year, against 22.3% the year before (Etsy Q4 and full year 2025 results)
- Across 60 tracked categories, new seller entry averaged 20.9% over twelve months (Podkon snapshot, 21 June 2026)
The take rate rose too
Etsy’s take rate, the share of gross merchandise sales the company keeps as revenue, reached 24.2% for the full year against 22.3% the year before. That is a rise of nearly two percentage points in a single year, and it lands on sellers.
Our fee breakdown covers what that means listing by listing, and Etsy’s Fees and Payments Policy sets out the current schedule.
📐 Technical Note
Take rate is not the same as what any individual seller pays. It aggregates listing fees, transaction fees, payments processing, advertising and services revenue across the whole platform, divided by total sales. A seller who uses no advertising pays considerably less than 24.2%; one who relies on Offsite Ads can pay more.
What the category data adds
Platform figures describe the whole marketplace. Category level measurement shows where the pressure actually lands. Across 60 tracked categories measured in a single snapshot, 42 were flagged as falling and 18 as flat, with none rising.
New seller entry over twelve months averaged 20.9%, ranging from 8.4% to 37.7%. And in 31 of 60 categories the median listing was already more than a year old, meaning much of the competing inventory is not being refreshed.
📌 Did You Know?
The seller base grew 7.7% while the buyer base shrank 2.0%. If both figures held for another year, the number of buyers per seller would fall by roughly nine percent annually. That ratio, rather than any single keyword or trend, is the arithmetic behind why individual shops report tougher conditions even in categories that look stable.
How to read Etsy statistics as a seller
Marketplace level etsy statistics do not mean every category declined, and marketplace level growth would not mean every category grew. What the aggregate tells you is the direction of the pressure: more sellers competing for slightly fewer buyers, at a slightly higher cost per sale.
What it does not tell you is where to sell, which is a category level question. Our what to sell breakdown covers making that choice, and our product research method covers validating it before you commit.
Statista’s active seller series tracks the seller count over a longer run, and Etsy’s Seller Handbook is the platform’s own guidance.
All category figures come from Podkon’s marketplace snapshot dated 21 June 2026 and describe the tracked listing sample, not all of Etsy. Etsy fee rates were current on the Fees and Payments Policy page as last updated 13 February 2026 and can change.
📚 See also: what these figures mean for a new shop in is Etsy worth it in 2026.
The Bigger Picture
Bottom Line: The important etsy statistics for 2026 are not the headline sales figures. They are the two lines moving in opposite directions: a seller base growing 7.7% a year against a buyer base shrinking 2.0%. That gap is what makes category choice matter more now than it did three years ago.