
Stockings on Etsy pull 1,989 views per listing, among the highest in this series, on the smallest monthly review volume in it. A June snapshot of a December product produces exactly that shape, and it is worth understanding before writing the category off.
Heavy interest, almost no sales, in June
1,989 views and 66 favorites per listing against 621 reviews in thirty days is the widest gap between attention and purchase measured anywhere in this series. People are looking at stockings in midsummer and buying them in December.
Favorites are the tell. A saved listing in a seasonal category is a purchase deferred rather than abandoned, and 66 per listing is a substantial pipeline sitting in people’s saved lists waiting for the season.
🔢 Quick Numbers
- 1,989 average views and 66 favorites per listing (snapshot, 21 June 2026)
- Only 621 reviews in 30 days at a June snapshot (snapshot, 21 June 2026)
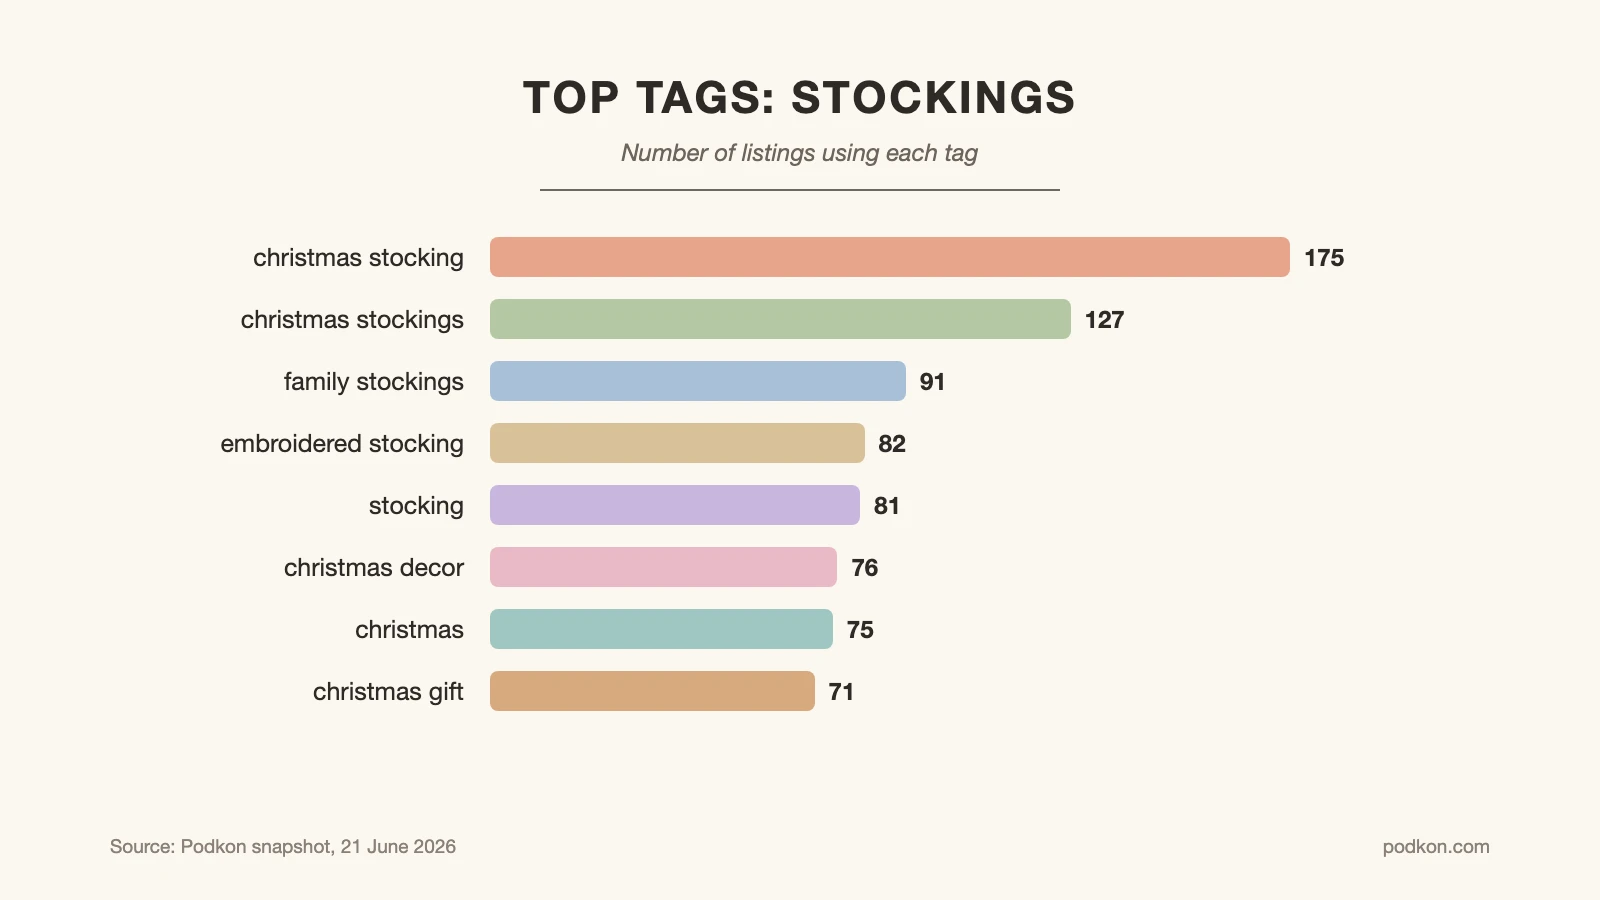
- Median price $30.03 with 23.2% of listings above $50 (snapshot, 21 June 2026)
- Only 11.5% of shops opened in the last 12 months (snapshot, 21 June 2026)
Personalisation and family sets
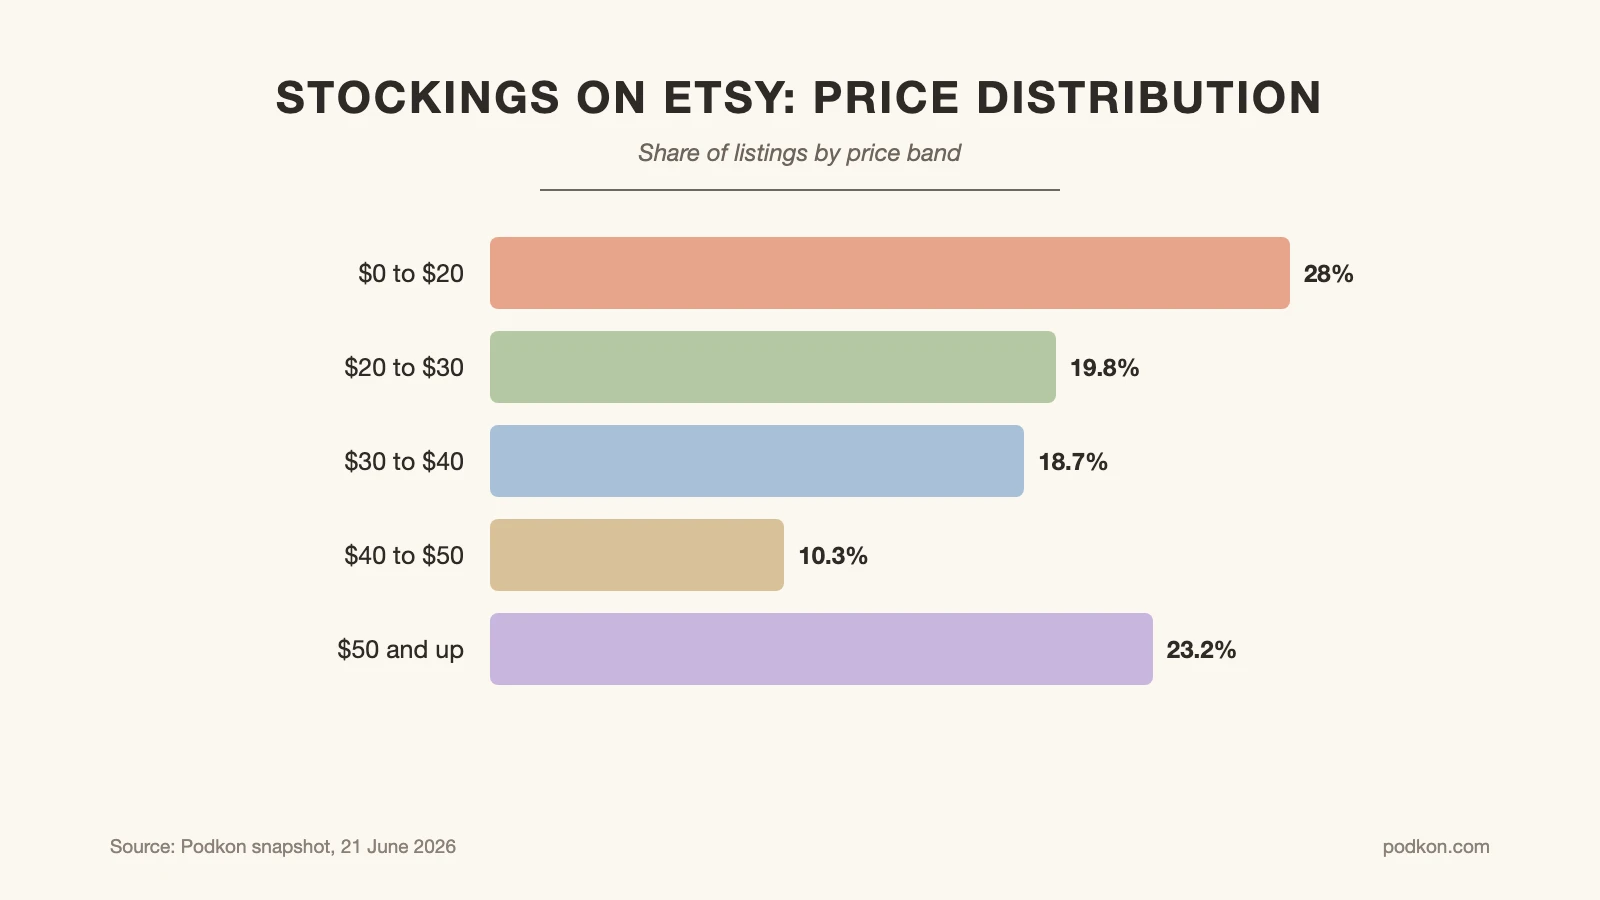
The tags sellers use most
| # | Tag | Listings using it |
|---|---|---|
| 1 | christmas stocking | 175 |
| 2 | christmas stockings | 127 |
| 3 | family stockings | 91 |
| 4 | embroidered stocking | 82 |
| 5 | stocking | 81 |
| 6 | christmas decor | 76 |
| 7 | christmas | 75 |
| 8 | christmas gift | 71 |
Family stockings ranks third and embroidered stocking fourth. The product is bought as a set, one per household member, and each one carries a name. That is why the price holds: 23.2% of listings sell above fifty dollars with a $30.03 median, high for a decorative textile.
Price distribution for stockings
| Listing price | Share of listings |
|---|---|
| $0 to $20 | 28% |
| $20 to $30 | 19.8% |
| $30 to $40 | 18.7% |
| $40 to $50 | 10.3% |
| $50 and up | 23.2% |
⚖️ Pros & Cons at a Glance
✔️ Pros: a $30.03 median with 23.2% above $50, 66 favorites per listing building a pipeline months ahead, and only 11.5% new competition a year
✖️ Cons: one selling quarter to fund four, embroidery equipment or a supplier to arrange, and personalised stock that cannot be resold if a name is wrong
The left hand column is what makes the right hand one worth accepting, provided you can plan a year ahead.
💡 Pro Tip
Publish in July and let the favorites accumulate. At 66 favorites per listing in a midsummer snapshot, this category is visibly being browsed months ahead of purchase, and a listing that appears in October has missed the window where that pipeline is built.
A settled field with an aging shelf
The median shop has been selling for 5 years and carries 251 active listings, with a 4.83 average rating and 11.5% arriving over twelve months. The median listing is 357 days old with only 188 added in the past week.
Reviews ran 27 over seven days, 621 over thirty and 836 over ninety, marked down at the June reading. Google Trends shows the annual curve, which is the only useful reference for a category this concentrated.
📌 Did You Know?
Across the sixty categories covered in this series, the pattern that appears most often is high browsing interest meeting a shelf nobody is restocking. This category shows it in its sharpest form: 1,989 views per listing against 188 new listings a week.
Reading stockings on Etsy as a seasonal category
Every number in this report is measured at the annual low point. That does not make them wrong, it makes them a baseline. The prices, the favorites and the entry rate are all structural and hold through the year; only the review volume is seasonal. Our low competition niches guide covers reading small fields, our product research method covers sizing a seasonal test, and our tag allocation guide covers seasonal term rotation.
Etsy’s Seller Handbook covers preparing listings ahead of a peak and Statista’s active seller series gives the marketplace backdrop.
All category figures come from Podkon’s marketplace snapshot dated 21 June 2026 and describe the tracked listing sample, not all of Etsy. Etsy fee rates were current on the Fees and Payments Policy page as last updated 13 February 2026 and can change.
Looking Ahead
This is the sixtieth and last category report in the series, and it ends on the pattern that ran through most of them. Attention is rarely the scarce thing on Etsy. Across these sixty categories the recurring shortage was fresh supply: shelves stocked years ago, still collecting views, still competing for searches nobody had updated a listing for. Whatever category you choose, the question worth asking first is not how crowded it is, but how long ago the crowd stopped paying attention.