

Etsy conversion benchmarks barely exist in public, which is why views but no sales is the most common complaint in seller forums, and it is almost always diagnosed without a reference point. Across 60 tracked categories it takes a median of 457 listing views to produce one review, and the range runs from 167 to 2,199.
A thirteenfold spread between categories
In Mugs a listing averages 265 views and 1.59 reviews a month, which works out at roughly 167 views per review. In Costumes the same calculation gives 2,199. Etsy conversion benchmarks are not comparable across categories, and comparing yourself to a general figure is how sellers reach the wrong conclusion.
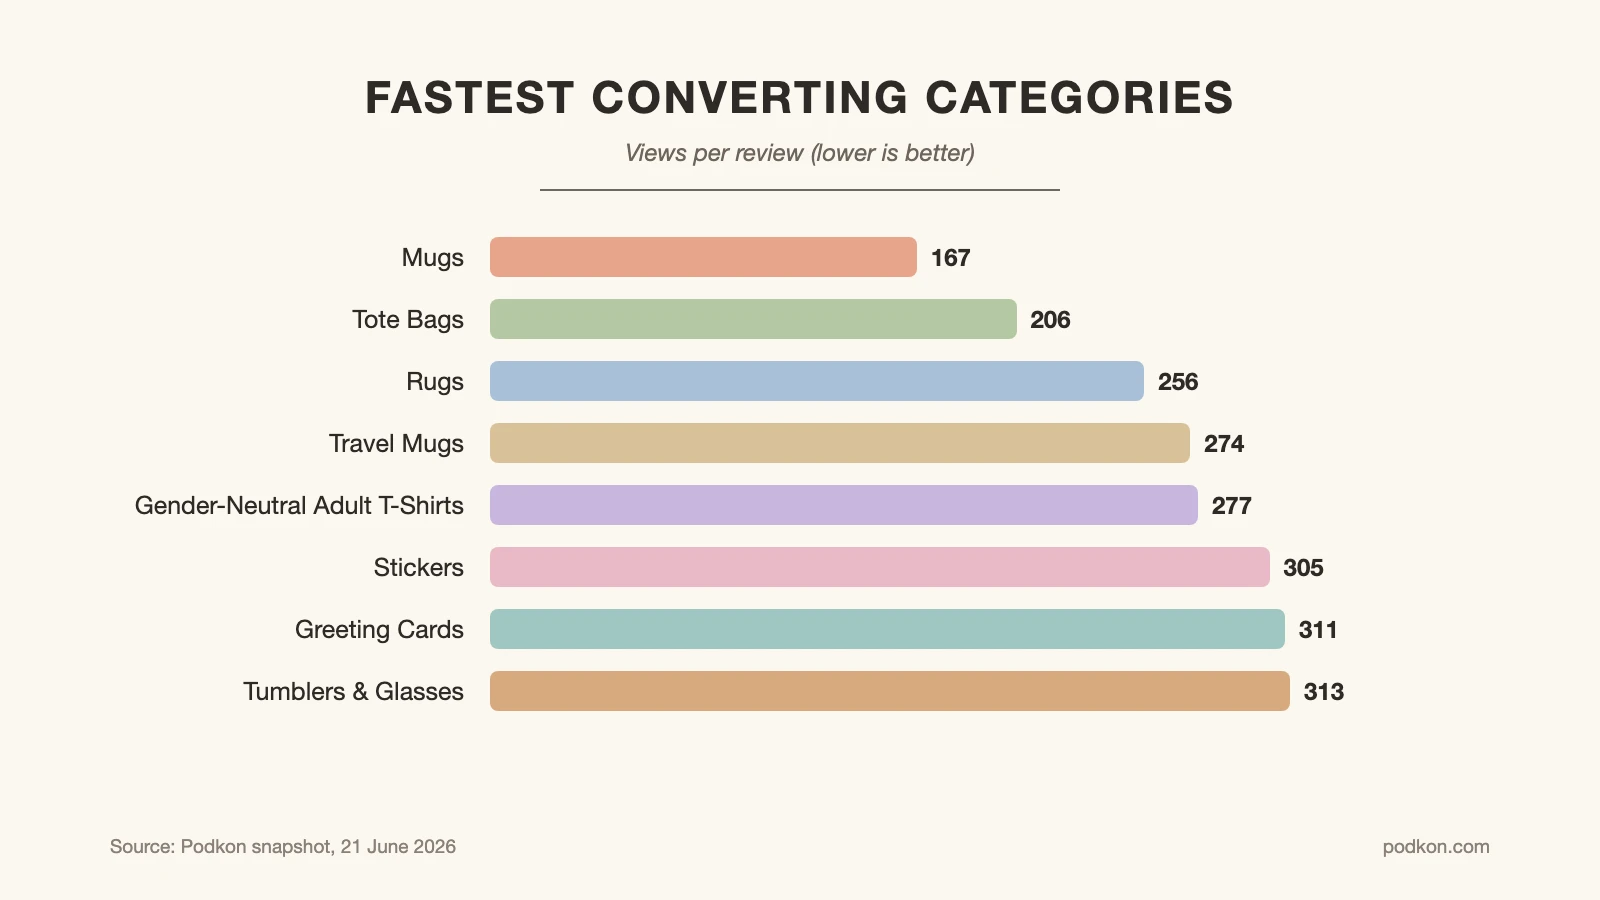
Where views convert fastest
| Category | Views per listing | Reviews per reviewed listing | Views per review |
|---|---|---|---|
| Mugs | 265 | 1.59 | 167 |
| Tote Bags | 367 | 1.78 | 206 |
| Rugs | 307 | 1.2 | 256 |
| Travel Mugs | 447 | 1.63 | 274 |
| Gender-Neutral Adult T-Shirts | 482 | 1.74 | 277 |
| Stickers | 469 | 1.54 | 305 |
| Greeting Cards | 526 | 1.69 | 311 |
| Tumblers & Glasses | 539 | 1.72 | 313 |
Every category at this end is a low priced, high intent purchase. Mugs, tote bags and travel mugs are bought by people who arrived knowing what they wanted, and browsing traffic is low precisely because nobody window shops them.
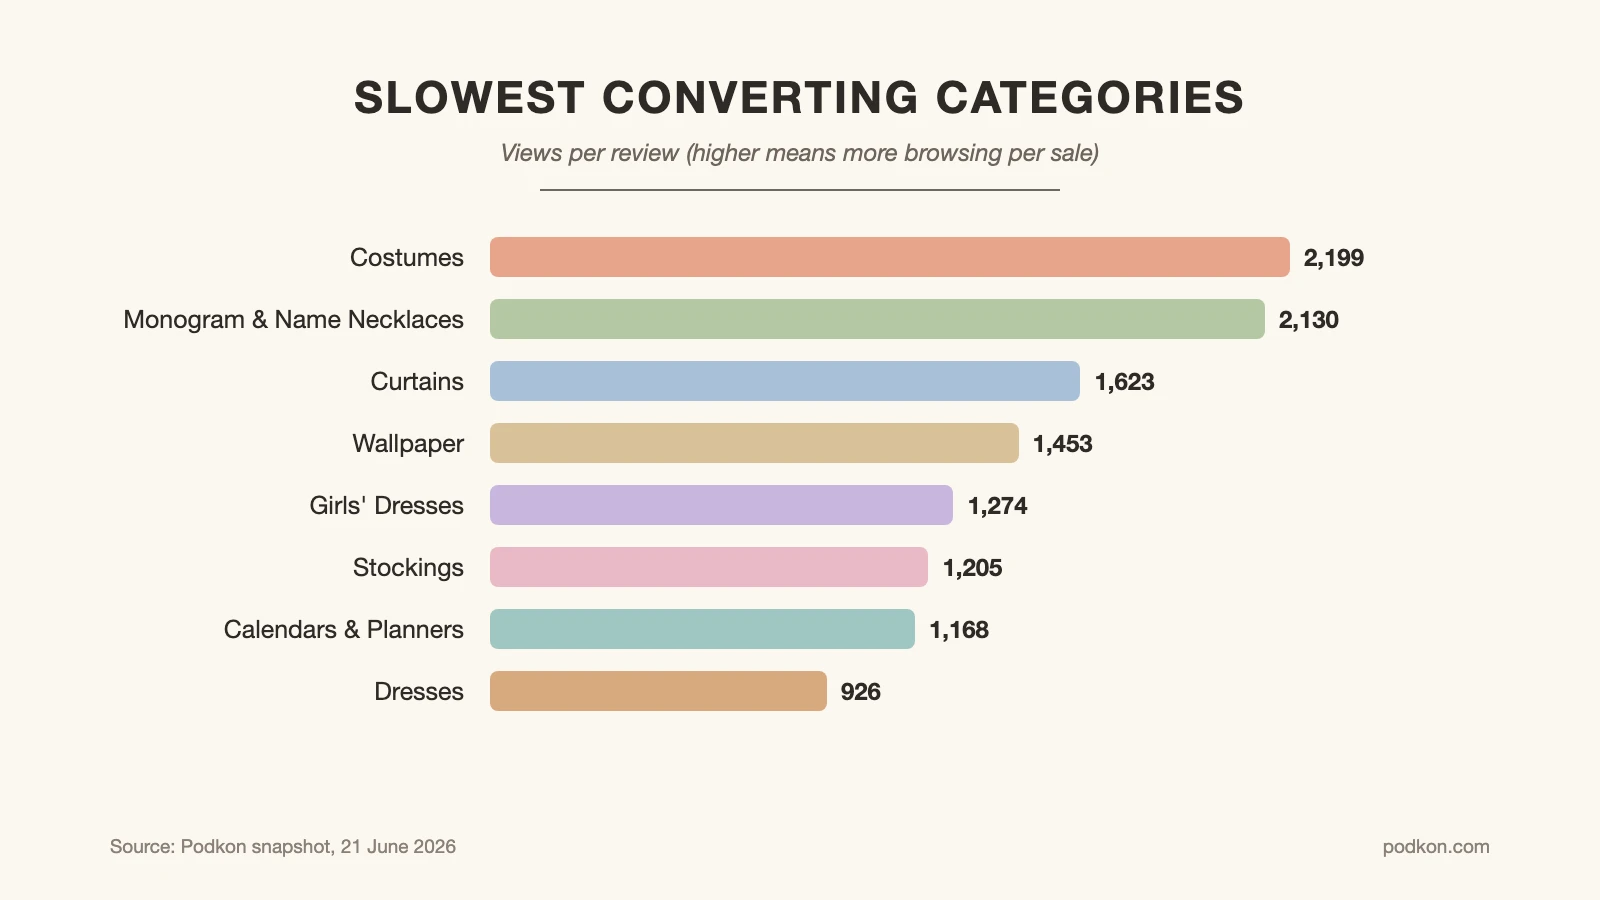
Where views convert slowest
| Category | Views per listing | Reviews per reviewed listing | Views per review |
|---|---|---|---|
| Costumes | 3,035 | 1.38 | 2,199 |
| Monogram & Name Necklaces | 4,452 | 2.09 | 2,130 |
| Curtains | 2,223 | 1.37 | 1,623 |
| Wallpaper | 1,642 | 1.13 | 1,453 |
| Girls’ Dresses | 1,567 | 1.23 | 1,274 |
| Stockings | 1,989 | 1.65 | 1,205 |
| Calendars & Planners | 1,483 | 1.27 | 1,168 |
| Dresses | 1,194 | 1.29 | 926 |
The slow end is dominated by personalised, expensive or size dependent products. Name necklaces, costumes, curtains and wallpaper all require a decision the buyer cannot reverse easily, so they compare extensively first.
🔢 Quick Numbers
- Median across 60 categories: 457 views per review (snapshot, 21 June 2026)
- Fastest converting: Mugs at about 167 views per review (snapshot, 21 June 2026)
- Slowest: Costumes at about 2,199 (snapshot, 21 June 2026)
- The spread between them is more than thirteenfold (snapshot, 21 June 2026)
Why high views can be good news
Read etsy conversion benchmarks in context: a category needing two thousand views per review is not performing badly. It is a considered purchase, and the views are the comparison process working. Sellers in those categories who benchmark against a general conversion figure conclude their listings are broken when the category is behaving exactly as it should.
The signal to worry about is a ratio far above your own category’s, not above the median. That points at something specific: photographs that do not answer the buyer’s question, missing measurements, or a price that reads wrong for the band.
📐 Technical Note
Reviews understate sales, and they understate them unevenly. Cheap impulse purchases attract fewer reviews per sale than expensive considered ones, which inflates the views per review figure at the low priced end of this table. Treat the ordering as reliable and the absolute numbers as a ceiling on true conversion rather than a measurement of it.
How to use Etsy conversion benchmarks on your own shop
To apply these etsy conversion benchmarks, take a thirty day period. Divide your total listing views by the number of reviews you received in that window. Compare the result against your category’s figure above, not against the median and not against another seller in a different market.
If you land close to your category, your listings are converting normally and your problem is traffic volume rather than listing quality. If you land far above it, the listings are the problem. Those are two completely different fixes, and the ratio is what tells them apart.
⚠️ Common Mistake to Avoid
Rewriting listings when the problem is reach. A seller in Mugs, where a listing averages only 265 views, has a visibility problem rather than a conversion one, and no amount of photograph editing fixes that. Check which side of the ratio your number sits on before you decide what to change.
What actually moves the ratio
In the slow converting categories the recurring fixes are the same across this series: full measurements in both units, the personalisation shown rather than described, and the exact model or size named in the title rather than hidden in a dropdown. Our listing photo guide covers the visual half, and our tag allocation guide covers matching the search.
Our Etsy SEO guide covers the traffic side if the ratio says reach is your constraint. Etsy’s Seller Handbook covers listing quality fundamentals, its full year 2025 results give the platform context, and Statista’s active seller series shows the competition those views are split across.
All category figures come from Podkon’s marketplace snapshot dated 21 June 2026 and describe the tracked listing sample, not all of Etsy. Etsy fee rates were current on the Fees and Payments Policy page as last updated 13 February 2026 and can change.
The Bigger Picture
Bottom Line: There is no single conversion benchmark on Etsy, and using one is the reason so many sellers rewrite listings that were never the problem. Find your category’s ratio first, then decide whether you are short of visitors or short of persuasion.